

Year-End Fundraising: Read the Results Before 2027 Planning
The busiest six weeks are also the most honest
For most nonprofits, the stretch between Giving Tuesday and December 31 is the year compressed into a few weeks.
Appeals go out daily.
Donation pages carry more traffic than they will see the rest of the year.
Every team, platform, and handoff runs at full load at the same time. That makes year-end the closest thing the sector has to a stress test. It shows, with unusual clarity, what holds up and what quietly shows its weaknesses.
The strange part is how little of that evidence makes it into the next plan. In January, the books close and the totals get reported. Up or down, the number becomes the story. By the time 2027 budgets are set, the reasons behind it have mostly been forgotten.
What December reveals
After 15 years and more than 1,000 nonprofit partnerships, we’ve learned that the problems year-end exposes are rarely dramatic. They’re small, structural, and easy to miss in the rush: a donation page that loads slowly on mobile, an email series nobody has tested in years, a donation platform and an email platform that don’t quite talk to each other.
None of these show up as a line item. They show up as money that never arrives.
Neither problem was hard to solve. Both were hard to see, and year-end is when they cost the most.
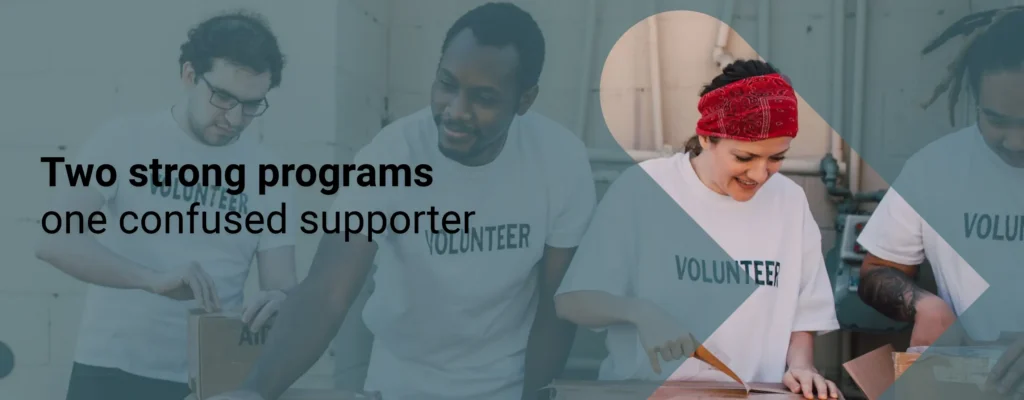
Two strong programs, one confused supporter
The costliest gaps usually sit between programs rather than inside one, and December is when they’re loudest.
Consider an organization, a composite of several we’ve worked with, that looks excellent on paper. Its donation pages convert at more than 30 percent, close to double the sector benchmark of roughly 17 percent. Its monthly giving program is healthy. Its advocacy list is large and responsive.
But fundraising and advocacy run as separate tracks: different teams, different calendars, different goals, no shared supporter file. At year-end, that split becomes visible from the outside. A loyal advocate receives a matching-gift deadline email and an urgent petition on the same afternoon, from what feels like two different organizations. Another advocate who has taken a dozen actions all year is never asked to give at all.
Your supporters already think of themselves as one person supporting one mission. Year-end is the best moment to ask whether your organization sees them that way too. And you can’t self-diagnose a gap between two things you’re each individually good at. It takes someone looking across both at once.

The Nonprofit Growth Map is the framework we built to turn that kind of evidence into a plan. It looks at eight Growth Drivers: Brand, Audience Intelligence, Technology + Data, Content + Creative, Paid Media, Organic Channels, Fundraising, and Advocacy. Each is assessed on its own, across three stages.
Build puts the foundation in place, the strategy, infrastructure, and tools a Driver needs to perform. Plenty of established nonprofits have gaps here, and closing them is often the highest-return investment available.
Optimize uses data and testing to keep improving. It has no finish line, and the strongest programs in the world live here across most of their Drivers.
Transcend means operating at a level that rivals the world’s best brands, not only the best nonprofits. It’s rare, and it’s earned over years.
Read together, the eight Drivers show where your organization is strong, where it’s constrained, and which investment would improve the most at once. That’s the conversation worth having before a 2027 budget gets locked.
“Sometimes the read surfaces a problem. Sometimes it tells you you’re further ahead than you thought.”
Ten minutes, and a read you keep
This year we turned the Growth Map into something any organization can use: the Nonprofit Marketing Growth Index, an annual benchmark of nonprofit marketing maturity. It takes about 10 minutes. In return, you get:
- A personalized maturity read across all eight Drivers
- A comparison against organizations of similar size, cause area, and budget
- A short recommendation from Media Cause strategists on where to focus in 2027
- An invitation to a webinar walking through the sector-wide results
- An invitation to our nonprofit forum, where you can bring growth questions to experts in real time
Sometimes the read surfaces a problem. Sometimes it tells you you’re further ahead than you thought.
The Index is also in its first year, which makes this year’s participants its founding cohort. Their answers set the benchmark the rest of the sector will measure against.
Between now and January
Year-end will tell you how much you raised. It can also tell you why, if you’re paying attention while it happens. Three steps make that easier:
- Take the Index now: [survey link]. Bring in whoever owns marketing, fundraising, measurement and advocacy so the answers reflect both.
- Keep notes through December. Write down what broke, what surprised you, and where supporters got mixed signals.
- Bring both into 2027 planning, and join the results webinar to see how you compare with peers.
The organizations that grow in 2027 will be the ones that understood their December best.
Your December results will tell you a lot. The Nonprofit Marketing Growth Index helps you make sense of them. In about 10 minutes, you’ll get a personalized read across all eight Growth Drivers, a benchmark against organizations like yours, and a recommendation from our strategists on where to focus in 2027. Take the Nonprofit Marketing Growth Index and join this year’s founding cohort.